

The origin of height and weight index standards traces back to the 19th century. It began with the Belgian astronomer and mathematician Adolphe Quetelet (1796–1874). He developed the foundational concept of the Quetelet Index between 1830 and 1850 as part of his work in “social physics.” Quetelet aimed to define the “average man” (l’homme moyen) by studying human physical characteristics using probability theory. In 1835, he published a treatise. It suggested that weight increases proportionally to the square of height. This introduced the formula of weight in kilograms divided by the square of height in meters, now known as the Body Mass Index (BMI).
This index was initially intended as a statistical tool for social and anthropometric analysis rather than a medical assessment. In 1842, Quetelet compiled the first table of average weight by age for Belgian men and women, establishing a reference for body weight based on height and age. Around the same time, British surgeon John Hutchinson published a table of average weights for 30-year-old Englishmen based on height, from 5 feet 1 inch to 6 feet, which became a standard for life insurance evaluations. In 1867, Fish adapted Hutchinson’s English tables for American populations in “The Agent’s Manual of Life Assurance,” further standardizing height-weight references across nations. The concept evolved through the 20th century, with the Metropolitan Life Insurance Company (MLIC) developing “ideal weight” tables in 1937 based on mortality data from over 4 million insured individuals, categorizing weight by sex, height, and body frame. These tables were revised in 1959 and used to define “desirable weight” based on associations with minimum mortality.
In 1972, Ancel Keys and colleagues formally coined the term “body mass index” (BMI) in a paper published in the Journal of Chronic Diseases, advocating it as a practical indicator of relative obesity for population studies, though noting its limitations for individual assessment. The World Health Organization (WHO) adopted the BMI classification system in 1995, establishing international standards based on mortality curves and health risks, which were later integrated into U.S. dietary guidelines in 2010. These developments reflect a progression from early anthropometric observations to standardized, globally recognized health indicators based on height and weight ratios.

The **Metropolitan Life Insurance Company (MLIC)** developed its 1937 “ideal weight” tables based on mortality data from approximately **4 million insured individuals between 1911 and 1935**. While the data was extensive, it was **not ethnically diverse**—it primarily included **white, working- and middle-class Americans** who were policyholders of the company during that era. Historical records indicate that MLIC, like many insurers at the time, engaged in **race-based underwriting practices**, often charging higher premiums or limiting coverage for non-white applicants due to perceived higher mortality risks. Internal documents show that the company was concerned about the racial composition of urban populations and implemented “area underwriting” to restrict policies in predominantly Black and Puerto Rican neighborhoods.
As a result, the 1937 dataset **over represented white individuals** and underrepresented minority populations, particularly African Americans and other marginalized groups. This lack of diversity means the “ideal weight” standards derived from this data may not be broadly applicable across different ethnic and socioeconomic groups, a limitation that has been recognized in later critiques of BMI and weight classification systems.
Between 1911 and 1935, the socioeconomic landscape of the United States was marked by **rapid industrialization, stark class divisions, racial segregation, and economic upheaval**, culminating in the Great Depression.
1. **Economic Structure and Class Stratification**- The U.S. economy was transitioning from agrarian to industrial, with growth in manufacturing, railroads, and finance.- A pronounced class structure emerged: – **Upper class**: Wealthy industrialists and financiers (e.g., Rockefellers, Carnegies) dominated business and high society. – **Middle class**: Expanded due to white-collar jobs in growing cities and corporations. – **Working class**: Comprised factory laborers, many of whom faced low wages, long hours, and poor conditions.- By the 1920s, **mass production and consumerism** fueled a boom, but wealth was highly concentrated—**the top 1% owned nearly 40% of national wealth by 1920**.
2. **Racial and Ethnic Inequality**- **Jim Crow laws** in the South enforced racial segregation in schools, transportation, and public life, with Black Americans systematically denied equal resources.- **Black schools received far less funding** than white schools, perpetuating educational and economic disparities.- **African Americans were largely excluded from economic gains** of the 1920s and faced widespread discrimination in employment and housing.- **Mexican, Asian, and Indigenous populations** also faced marginalization, with restrictive immigration laws (e.g., 1924 Immigration Act) targeting non-European groups.
3. **Urban vs. Rural Divide**- **Urban areas** thrived with modernization, cultural innovation (e.g., jazz, flappers), and new technologies.- **Rural regions**, especially in the South and Great Plains, lagged economically and socially, clinging to traditional values—highlighted by the **Scopes Trial (1925)** over evolution education.

4. **The Great Depression (1929–1935)**- The **1929 stock market crash** triggered a decade-long economic collapse.- By 1933, **25% of workers were unemployed**, banks failed, and millions lost homes and savings.- **Hoovervilles** (makeshift shantytowns) emerged, and **farmers in the Dust Bowl** faced displacement, leading to mass migrations like the “Okies” to California.- **New Deal programs (1933 onward)** under FDR expanded federal relief, but **minority groups were often excluded** from benefits due to discriminatory implementation.
5. **Gender and Labor**- Women entered the workforce in greater numbers, especially during WWI and WWII, but were often relegated to low-paying jobs (e.g., domestic service, textiles).
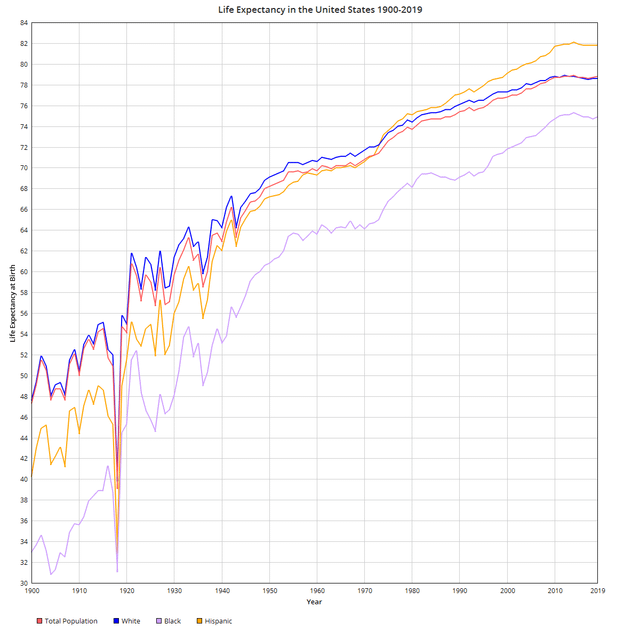
– The **GI Bill (1944)** later boosted middle-class growth but **disproportionately benefited white men** due to redlining and segregation. Between **1911 and 1940**, life expectancy and health in the United States improved significantly, though with notable disparities.
Life Expectancy-
In **1911**, life expectancy at birth was approximately **52.6 years**.- By **1940**, it had risen to **62.9 years**.- A major exception was **1918**, when the influenza pandemic caused a sharp drop—to **39.1 years**—due to high mortality across all age groups.
Health Status- **Infant mortality** was high: around **100 deaths per 1,000 live births** in 1915 for white infants, and nearly double for Black infants.- **Leading causes of death** were **infectious diseases** such as pneumonia, tuberculosis, and gastrointestinal infections.-
Public health advances—**improved sanitation, nutrition, vaccination, and early antibiotics**—drove mortality declines.- **Chronic diseases** like heart disease and cancer became more prominent as infectious disease deaths fell.
Racial Disparities- In **1940**, life expectancy for **Black Americans** was about **54.9 years**, compared to **66.6 years** for whites, reflecting systemic inequalities in healthcare, living conditions, and socioeconomic status.

Between **1911 and 1940**, the nutritional status of the average American improved but remained uneven due to economic, regional, and racial disparities.
Key Aspects of Nutritional Status:
1. **Diet Composition**: – The typical diet was **rich in whole, unprocessed foods**—fresh vegetables, grains, and meats—often sourced locally or grown at home. – **Meat consumption was high**, with estimates of 150–200 pounds per person annually in the late 19th and early 20th centuries. – **Bread, potatoes, pork, and beef** were dietary staples; **chicken** was considered a luxury and consumed less frequently. – **Processed foods and added sugars** were minimal compared to modern diets.
2. **Nutritional Deficiencies**: – **Pellagra**, caused by niacin (vitamin B3) deficiency, was widespread in the South due to a corn-heavy, monotonous diet among poor populations. Between 1906 and 1940, there were **3 million cases and 100,000 deaths** attributed to pellagra. – **Rickets** (vitamin D deficiency) affected up to **75% of children** in northern cities like New York due to limited sunlight and lack of fortified foods. – **Goiter** (iodine deficiency) was common, especially in the Great Lakes region, with rates as high as **38.6%** in Michigan before iodized salt was introduced.
3. **Public Health Interventions**: – **Food fortification** began in the 1920s–1940s: iodine was added to salt (1924), and milk was fortified with vitamin D to combat rickets. – The **1941 National Nutrition Conference** led to the first **Recommended Dietary Allowances (RDAs)** and **enrichment of wheat flour** with iron and B vitamins (including niacin), which helped eliminate widespread deficiencies by the 1950s.
4. **Socioeconomic and Regional Disparities**:
– Poor and rural populations, especially in the South, faced **monotonous diets** high in cornmeal, fatback, and molasses, leading to malnutrition.
– The **Great Depression (1930s)** exacerbated food insecurity, though federal programs like school lunches (initiated in 1946) began to address child nutrition. By the end of this period, scientific understanding of vitamins and essential nutrients had transformed public health, laying the foundation for modern dietary guidance.

Today, **BMI** is used as a primary screening tool to assess obesity and guide health interventions, including **pharmaceutical prescriptions for weight control**.
Health Assessment-
**BMI thresholds** define weight categories: – **Overweight**: BMI ≥25 to <30 – **Obesity**: BMI ≥30- While BMI is widely used, it has limitations—it doesn’t distinguish between fat and muscle mass or account for fat distribution. As a result, **waist-to-height ratio and metabolic markers** are increasingly used alongside BMI for a more accurate health assessment.
Pharmaceutical Prescriptions- **GLP-1 receptor agonists** (e.g., semaglutide/Wegovy, tirzepatide/Zepbound) are prescribed based on BMI and comorbidities: – **FDA-approved criteria**: – BMI ≥30 (obesity), or – BMI ≥27 with at least one weight-related condition (e.g., type 2 diabetes, hypertension).
– Emerging guidelines, such as those from the **Lancet Commission (2025)** and **EASO**, propose redefining “overweight” as **preclinical obesity**, expanding eligibility to individuals with a BMI ≥25 and elevated waist-to-height ratio (≥0.5) or metabolic issues.- These medications are intended for **chronic use** alongside lifestyle changes and are not for cosmetic weight loss. Clinical Impact- Even **5–10% weight loss** improves blood pressure, glycemic control, lipid profiles, and sleep apnea.- Treatment is personalized, with ongoing monitoring every 3 months during active weight management.
Today, **BMI is a key criterion for determining eligibility for surgical weight control interventions**, such as bariatric surgery. Surgical Eligibility Criteria (2026):- **Standard criteria**: – **BMI ≥40**, or – **BMI ≥35 with at least one obesity-related comorbidity** (e.g., type 2 diabetes, hypertension, obstructive sleep apnea).- **Revised guidelines** (ASMBS/IFSO, 2022–2023) recommend: – Surgery for individuals with **BMI ≥35, regardless of comorbidities**. – Consideration for those with **BMI 30–34.9 and metabolic disease**.- **For Asian populations**, thresholds are lower: – Surgery recommended at **BMI ≥27.5**, due to higher metabolic risk at lower BMI.- **Adolescents** (12–17 years) may qualify with: – Class III obesity (BMI ≥35) plus comorbidities, or BMI ≥40.
Additional Requirements:
– Failed attempts at sustained weight loss through lifestyle and medical interventions.- Preoperative evaluations including **psychological, nutritional, and medical assessments**.- Commitment to long-term follow-up and lifestyle changes.
BMI remains a screening tool, but decisions are increasingly personalized, incorporating metabolic health and individual risk factors.
The U.S. medical and pharmaceutical industry has generated substantial revenue from weight loss interventions over the past 50 years, with exponential growth in recent years.-
In **2023**, the total U.S. weight loss market reached **$90 billion**, driven by a surge in prescription weight loss drugs, particularly **GLP-1 agonists** like Wegovy and Zepbound.
– The **prescription obesity drug market** alone grew from **$5.1 billion in 2022 to $11.9 billion in 2023**, more than doubling.- The **medical weight loss market** (including drugs, surgery, and clinical programs) hit **$33.8 billion in 2024**, more than double its 2022 value.
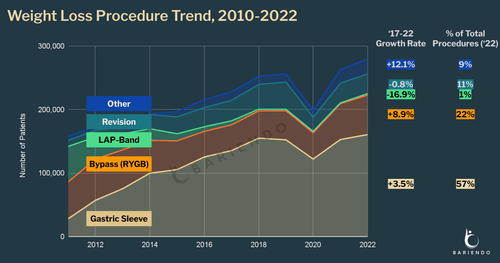
– **Bariatric surgery** has also seen rising volumes, though exact revenue figures are not specified in the data.- Analysts project the **global anti-obesity drug market** could reach **$100–150 billion annually** within the next decade, with Novo Nordisk and Eli Lilly leading profits. While comprehensive 50-year cumulative revenue data is not available, the market has shifted dramatically from commercial diet programs to high-cost medical and pharmaceutical interventions, generating **tens of billions in annual revenue** in the 2020s.

Insurance companies in the U.S. spend significantly more on **treating diseases** than on **prevention**.
– In **2019**, spending on preventive services accounted for only **3.5% of total health care spending** among employer-sponsored insurance (ESI) enrollees—about **$204 per person annually**.
– Despite the Affordable Care Act (ACA) requiring **no-cost coverage** for recommended preventive services (e.g., cancer screenings, immunizations, wellness visits), these services represent a small fraction of overall health expenditures.- A major reason is that **chronic diseases** (e.g., heart disease, diabetes) drive **90% of the $4.1 trillion in annual U.S. health care costs**, most of which goes toward treatment rather than prevention.
– While some preventive measures (e.g., childhood immunizations, smoking cessation) are **cost-saving**, many do not reduce overall spending and may even increase short-term costs, though they improve long-term health outcomes.- Insurance design often prioritizes acute and chronic care, and even modest out-of-pocket costs for prevention can reduce utilization, leading to higher downstream treatment costs.
In summary, while prevention is emphasized, the U.S. health system remains **heavily skewed toward treatment spending**. Insurance companies do not typically report direct spending on fitness and nutrition prevention separate from broader wellness programs, but employer-sponsored wellness initiatives—often funded or incentivized by insurers—provide insight.
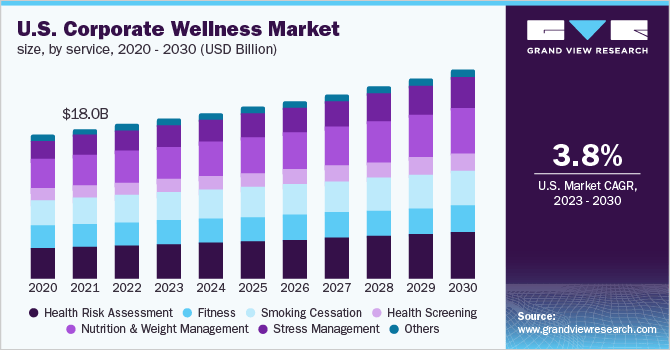
– **Wellness programs** are commonly offered through employers, with **average costs around $693 per employee per year**.- These programs often include **fitness incentives, nutrition counseling, biometric screenings, and health coaching**, but do not include drug or surgery costs.
– Financial incentives such as **premium discounts, HSA contributions, or lower deductibles** are used to encourage participation, with some employers offering **$50–$600 annually** in benefits-based rewards.- A 2015 survey estimated **$8 billion in annual revenues** for the corporate wellness industry, reflecting insurer and employer investment in prevention. While exact figures for insurer-specific spending on fitness and nutrition alone are not available, these programs are designed to reduce long-term disease treatment costs through preventive engagement. Specific data on the exact percentage of corporate wellness program budgets allocated to nutrition versus fitness is not available in the search results. However, wellness programs typically include both components as part of broader initiatives.
– **Fitness** commonly includes gym memberships, onsite or virtual exercise classes (e.g., yoga, Zumba), fitness challenges, and wearable device integration.
– **Nutrition** initiatives include healthy snacks at work, nutrition workshops, access to dietitians, and educational sessions on healthy eating. Budgets vary by company size and industry, with **small businesses** focusing on low-cost options and **large enterprises** offering comprehensive services. While both areas are funded, exact spending splits between nutrition and fitness are not standardized or widely reported.
Discover more from Rich Kilchrist RDN LDN Registered Dietitian & Licensed Nutritionist
Subscribe to get the latest posts sent to your email.
