
This Registered Dietitian Proposal to the FDA Proposal & an Equitable Solution to the Real Epidemic & Healthcare System Relief
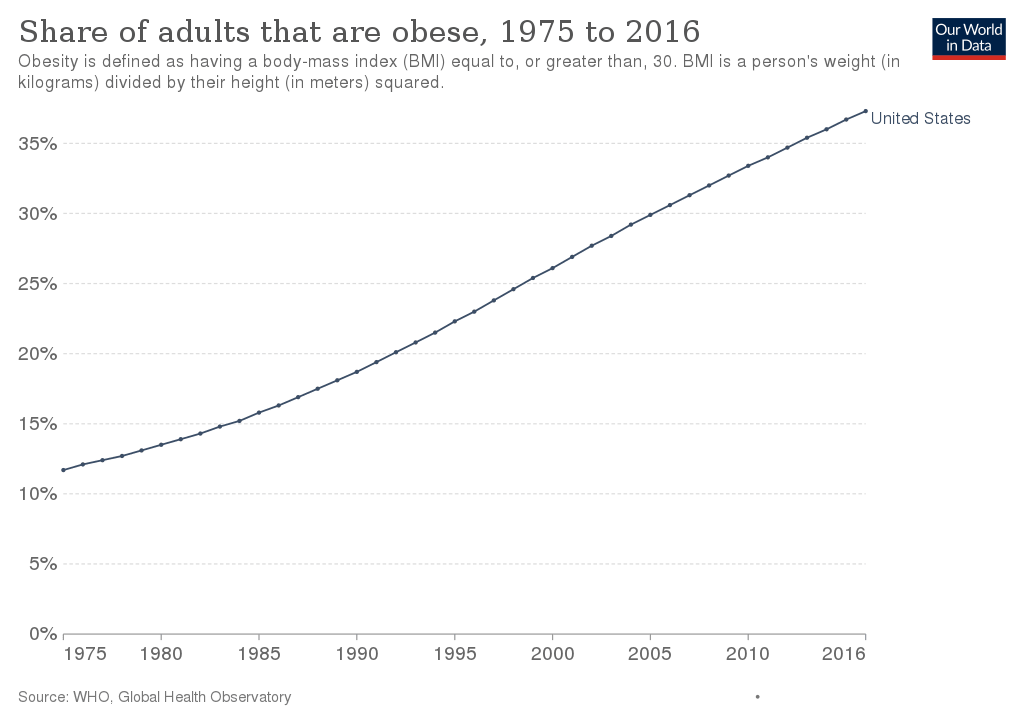
Obesity
The prevalence of obesity and overweight has increased dramatically in the United States since the mid-1970s, and nearly two of three adult Americans are either overweight or obese. Although high costs—in health, social, and economic terms—are known to be associated with obesity, how the U.S. population reached this point is less well understood.
Examining the causes of the increase in obesity and proposed interventions under an economist’s lens may help identify potential solutions to the obesity crisis. To help address growing public health concerns about rising obesity rates, ERS research examines:
- differences in dietary patterns by social, demographic, and economic factors,
- how economic incentives and behavioral factors influence food choices and diet quality,
- how food choices affect diet quality and health,
- the association between dietary patterns and obesity, and
- the intended and unintended consequences of obesity policies.
On September 28th 2022, the U.S. Food and Drug Administration proposed updated criteria for when foods can be labeled with the nutrient content claim “healthy” on their packaging. This proposed rule would align the definition of the “healthy” claim with current nutrition science, the updated Nutrition Facts label and the current Dietary Guidelines for Americans.
More than 80% of people in the U.S. aren’t eating enough vegetables, fruit and dairy. And most people consume too much added sugars, saturated fat and sodium. The proposed rule is part of the agency’s ongoing commitment to helping consumers improve nutrition and dietary patterns to help reduce the burden of chronic disease and advance health equity.
The proposed rule comes on the heels of the White House Conference on Hunger, Nutrition, and Health, as well as the release of the related national strategy, which aims to end hunger, improve nutrition and physical activity, reduce diet-related diseases and close disparity gaps by 2030.
“Nutrition is key to improving our nation’s health,” said HHS Secretary Xavier Becerra. “Healthy food can lower our risk for chronic disease. But too many people may not know what constitutes healthy food. FDA’s move will help educate more Americans to improve health outcomes, tackle health disparities and save lives.”
The proposed rule would update the “healthy” claim definition to better account for how all the nutrients in various food groups contribute and may work synergistically to create healthy dietary patterns and improve health. Under the proposed definition for the updated “healthy” claim, which is based on current nutrition science, more foods that are part of a healthy dietary pattern and recommended by the Dietary Guidelines would be eligible to use the claim on their labeling, including nuts and seeds, higher fat fish (such as salmon), certain oils and water.
“Diet-related chronic diseases, such as cardiovascular disease and Type 2 diabetes, are the leading causes of death and disability in the U.S. and disproportionately impact racial and ethnic minority groups,” said FDA Commissioner Robert M. Califf, M.D. “Today’s action is an important step toward accomplishing a number of nutrition-related priorities, which include empowering consumers with information to choose healthier diets and establishing healthy eating habits early. It can also result in a healthier food supply.”
Under the proposed definition, in order to be labeled with the “healthy” claim on food packaging, the products would need to:
- Contain a certain meaningful amount of food from at least one of the food groups or subgroups (e.g., fruit, vegetable, dairy, etc.) recommended by the Dietary Guidelines.
- Adhere to specific limits for certain nutrients, such as saturated fat, sodium and added sugars. The threshold for the limits is based on a percent of the Daily Value (DV) for the nutrient and varies depending on the food and food group. The limit for sodium is 10% of the DV per serving (230 milligrams per serving).
For example, a cereal would need to contain ¾ ounces of whole grains and contain no more than 1 gram of saturated fat, 230 milligrams of sodium and 2.5 grams of added sugars.
“Healthy eating patterns are associated with improved health, yet most people’s eating patterns do not align with current dietary recommendations,” said Susan Mayne, Ph.D., director of the FDA Center for Food Safety and Applied Nutrition. “In addition to today’s action, we continue to advance a number of FDA initiatives and explore new ways to coordinate, leverage and amplify important work going on across the nutrition ecosystem to help improve people’s diets and make a profound impact on the health of current and future generations.”
Along with empowering consumers, adopting the updated definition may help foster a healthier food supply if some manufacturers reformulate (e.g., add more vegetables or whole grains to meet criteria) or develop products that meet the updated definition.
Because consumers have long been interested in finding ways to more easily identify healthy foods, the agency is also in the process of studying and exploring the development of a symbol that manufacturers could use to show that their product meets the “healthy” claim criteria. The agency realizes that consumers are busy and, while shopping, may be seeking a quick way to identify and select healthy products. The updated “healthy” claim, and potential symbol, together would act as quick signals to help consumers identify healthier food choices more easily.
The FDA is participating in today’s White House Conference on Hunger, Nutrition, and Health and will continue to take steps in support of the national strategy to improve nutrition and health and empower all consumers to make and have access to healthy choices. Specifically, the agency remains committed to continuing to create a healthier food supply through its recently released guidance to reduce sodium in processed, packaged and prepared foods; to providing consumers with accessible nutrition information about the foods they eat; and to providing industry with recommendations on how to use dietary guidance statements on food labeling. Future planned actions include:
- Developing a front-of-package (FOP) labeling system to quickly and more easily communicate nutrition information to empower consumers to make healthy decisions.
- Facilitating making nutrition information easily available when grocery shopping online.
- Facilitating lowering the sodium content of food in the food supply, including by issuing revised, lower voluntary sodium reduction targets for industry.
- Holding a public meeting regarding future steps the federal government could take to facilitate lowering added sugar consumption.
- Releasing additional education and outreach efforts to ensure that parents and caregivers are aware of the latest recommendations for healthy eating in young children and for taking steps to reduce exposure to toxic elements in food.
🤔 OK- HOW ABOUT WE HAVE STORES THAT ONLY SELL “HEALTHY” FOODS! THESE STORES COULD BE CALLED, OH I DON’T KNOW, “REAL-FOODS” & THE OTHER GROCERY STORES COULD SELL EVERYTHING DEEMED UNHEALTHY!
🍇 🍆 🥕 🍉 🌽 🍌 🥒 🍍 🥭 🥦 🥬 🍎 🍐 🧅 🍄 🍑 🍒 🥜
HERE’S THE CATCH, SNAPS, STAMPS, GOVT ASSISTANCE FOOD PROGRAMS CAN ONLY BE ACCEPTED IN THE “REAL-FOODS” STORE!
🥑 🍅 🥝 🍑 🥦 🍎 🥭 🍍 🍌 🍋
CHECK THE BOX FOR EQUITY! ☑️
TACKLE THE REAL EPIDEMIC THAT HAS PLAGUED THE USA FOR THE LAST 40 YEARS.
💀 ☠️ 💀 ☠️ 💀 ☠️
NOW FOR AN ADD CATCH-EVERYONE THAT IS ENROLLED IN THE FOOD ASSISTANCE PROGRAMS CAN GET ADDITIONAL CREDITS AWARDED TO THEIR ACCOUNTS FOR EVERY MEMBER IN THE HOUSEHOLD IF THEY MEET CERTAIN AMOUNT OF STEP COUNTS RECORDED FROM WORN DIGITAL DEVICES!
🏃 🏃♂️ 🏃♀️ 🚶♀️ 🚶♂️ 🚶 ___STEP FOR SNAPS REWARD PROGRAM!___
Food Security Status of U.S. Households in 2021
Food secure—These households had access, at all times, to enough food for an active, healthy life for all household members.
- 89.8 percent (118.5 million) of U.S. households were food secure throughout 2021.
- Essentially unchanged, or not significantly different, from 89.5 percent in 2020.
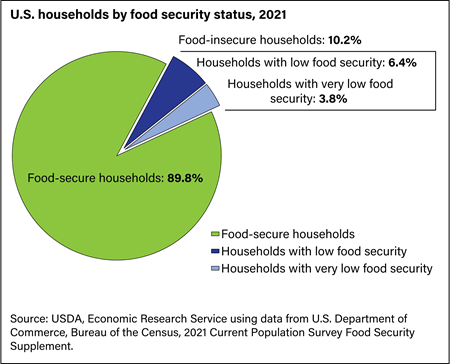
Food insecure—At times during the year, these households were uncertain of having or unable to acquire enough food to meet the needs of all their members because they had insufficient money or other resources for food. Food-insecure households include those with low food security and very low food security.
- 10.2 percent (13.5 million) of U.S. households were food insecure at some time during 2021.
- Essentially unchanged from 10.5 percent in 2020.
Low food security—These food-insecure households obtained enough food to avoid substantially disrupting their eating patterns or reducing food intake by using a variety of coping strategies, such as eating less varied diets, participating in Federal food assistance programs, or getting food from community food pantries.
- 6.4 percent (8.4 million) of U.S. households had low food security in 2021.
- Essentially unchanged from 6.6 percent in 2020.
Very low food security—In these food-insecure households, normal eating patterns of one or more household members were disrupted and food intake was reduced at times during the year because they had insufficient money or other resources for food.
- 3.8 percent (5.1 million) of U.S. households had very low food security at some time during 2021.
- This estimate is essentially unchanged from 3.9 percent in 2020.
Food Security Status of U.S. Households with Children in 2021
Among U.S. households with children under age 18:
- 87.5 percent of households with children were food secure in 2021.
- Household food insecurity affected 12.5 percent of households with children in 2021. In some of these food-insecure households only adults were food insecure, while in other households children also experienced food insecurity.
- In 6.3 percent of households with children, only adults were food insecure.
- Both children and adults were food insecure in 6.2 percent of households with children (2.3 million households).
- Children are usually protected from substantial reductions in food intake even in households with very low food security. Nevertheless, in about 0.7 percent of households with children (274,000 households), one or more child also experienced reduced food intake and disrupted eating patterns at some time during the year.

How Many People Lived in Food-insecure Households?
In 2021:
- 33.8 million people lived in food-insecure households.
- 8.6 million adults lived in households with very low food security.
- 5.0 million children lived in food-insecure households in which children, along with adults, were food insecure.
- 521,000 children (0.7 percent of the Nation’s children) lived in households in which one or more child experienced very low food security.
For more information, see Food Insecurity in the U.S.: Frequency of Food Insecurity.
Food Insecurity by Household Characteristics
The prevalence of food insecurity varied considerably among household types. Rates of food insecurity were higher than the national average (10.2 percent) for the following groups:
- All households with children (12.5 percent).
- Households with children under age 6 (12.9 percent).
- Households with children headed by a single woman (24.3 percent) or a single man (16.2 percent).
- Women living alone (13.2 percent) and men living alone (12.3 percent).
- Households with Black, non-Hispanic (19.8 percent) and Hispanic reference persons (16.2 percent; a household reference person is an adult household member in whose name the housing unit is owned or rented).
- Households with incomes below 185 percent of the poverty threshold (26.5 percent; the Federal poverty line was $27,479 for a family of four in 2021).

- Overall, households with children had a substantially higher rate of food insecurity (12.5 percent) than those without children (9.4 percent). Among households with children, married couple families had the lowest rate of food insecurity (7.4 percent).
- The prevalence of food insecurity was highest for households located in principal cities of metropolitan areas (12.2 percent), near the national average in nonmetropolitan areas (10.8 percent), and lowest in suburban and other metropolitan areas outside principal cities (8.8 percent).
- Regionally, the prevalence of food insecurity in the Northeast (8.8 percent) was significantly below the U.S. average, while the prevalence in the South (11.4 percent) was significantly above the U.S. average.
Very Low Food Security by Household Characteristics
The prevalence of very low food security in various types of households followed a pattern similar to that observed for food insecurity overall. Very low food security was more prevalent than the national average (3.8 percent) for the following groups:
- Households with children headed by a single woman (8.0 percent).
- Women living alone (6.0 percent) and men living alone (5.9 percent).
- Households with reference persons who are Black, non-Hispanic (7.9 percent) and Hispanic (5.5 percent).
- Households with incomes below 185 percent of the poverty line (10.2 percent).
- Households located in principal cities (4.6 percent).

Trends in Prevalence Rates
The 2021 prevalence of food insecurity (10.2 percent) was not significantly different from the 2020 and 2019 prevalence of 10.5 percent. Regarding earlier trends, a statistically-significant decline in the prevalence of food insecurity from 11.1 percent in 2018 to 10.5 percent occurred in 2019. For the first time, in 2019, food insecurity was statistically significantly—at the 90 percent confidence level—below the 11.1 percent pre-recession level of 2007.
The prevalence of very low food security in 2021 (3.8 percent) was not significantly different from the prevalence in 2020 (3.9 percent) or 2019 (4.1 percent). The prevalence of very low food security in 2021 was significantly lower than the prevalence in 2018 (4.3 percent).
The year-to-year deviations from a consistent downward trend between 1995 and 2000 include a substantial 2-year cycle that is believed to result from seasonal effects on food security prevalence rates. The Current Population Survey (CPS) food security surveys over this period were conducted in April in odd-numbered years and August or September in even-numbered years. Measured prevalence of food insecurity was higher in the August/September collections, suggesting a seasonal-response effect. In 2001 and later years, the surveys were conducted in early December, which avoided seasonal effects in interpreting annual changes.

State-level Prevalence of Food Insecurity
Prevalence rates of food insecurity varied considerably from State to State. Data for 3 years, 2019–2021, were combined to provide more reliable statistics at the State level. Estimated prevalence rates of food insecurity during this 3-year period ranged from 5.4 percent in New Hampshire to 15.3 percent in Mississippi; estimated prevalence rates of very low food security ranged from 1.8 percent in North Dakota to 6.3 percent in Arkansas.

Trends in USDA Foods Ordered for Child
Nutrition Programs Before and After
Updated Nutrition Standards
What Is the Issue?
In addition to cash meal reimbursements, USDA helps compensate schools for
the cost of meals served through the National School Lunch Program (NSLP)
through a program called USDA Foods in Schools (USDA Foods). Under the
USDA Foods Program, USDA purchases foods from suppliers on behalf of
schools, using entitlement funds made available for that purpose on the basis of
the number of school lunches served in the previous year. Foods offered in the
USDA Foods Program include foods typically included in school meals—such
as cheese, meat, fruits and vegetables, and grain products—and are selected
with input from Federal, State and local program staff. Each year, States
select from foods available and can obtain fresh fruits and vegetables from the
USDA Department of Defense (DoD) Fresh Fruit and Vegetable (DoD Fresh)
Program. DoD Fresh permits States participating in USDA Foods to obtain
fresh fruits and vegetables from the DoD Defense Logistics Agency (DLA) of Philadelphia.
USDA Foods provided 11 percent of the value of foods obtained by USDA school meal programs in school year 2009–10(the most recent available data on school food purchasing). In 2021 dollars, this number would translate to a value of about $1.40 billion for the 50 States and the District of Columbia. USDA budget figures indicate that spending on USDA Foods has not changed in real terms from 2011 to 2018 (the last available budgetary data). Besides the financial support, USDA Foods also increased school food service access to healthy options that align with USDA school meal nutrition standards (USDA, FNS, 2021) and can help school food authorities (SFAs) meet nutrition standards.
Passage of the Healthy, Hunger-Free Kids Act in 2010 resulted in major updates in school meal nutrition standards that began to be implemented in 2012. These updates required USDA school meals to include whole-grain-rich foods, more fruits and legumes, and a broader mix of vegetables (including dark green and red/orange vegetables). The purpose of this report is to examine changes in food choices in the USDA Foods program during 2006–2017 in response to revised nutrition standards implemented in 2012.
What Did the Study Find?
• In the years following implementation of updated nutrition standards, foods made available to schools through the USDA Foods Program included more products that supported achievement of the standards, such as dark green vegetables and whole grains. Product offerings were also included with reduced fat, sodium, and sugar content.
• The percent of fruits and vegetables distributed through the USDA Department of Defense (DoD) Fresh program rose sharply, from 6 percent of total USDA Foods distributed in 2012 to 15 percent of total USDA Foods entitlement funds used in 2017.
• Fruit from USDA Foods—mainly canned and frozen—as a percent of total USDA Foods entitlement funds used, rose 66 percent, from 9 percent in 2012 to 15 percent in 2017.
• Cheese, poultry, and red meat obtained with USDA entitlement funds dropped to a range of 60–70 percent of USDA Foods entitlement funds used during 2012–17 (from 65 to 75 percent of USDA Foods entitlement funds used during 2006–11).
How Was the Study Conducted?
Data were compiled from USDA Budget Explanatory Notes, as provided by the USDA Food and Nutrition Service (FNS) for fiscal years (FYs) 2008–19. These notes indicate past, current, and proposed budgets, past expenditures, and agency and program information. The Budgetary Notes for FNS identify food obtained with USDA Food entitlement funds under the USDA Foods program. For this study, foods were categorized by food type and quality.
For example, green beans were placed in the other-vegetable category, consistent with their classification in school meal guidelines. Data were then summarized graphically and evaluated, with means tests between the periods
before and after changes in nutrition standards and trend analysis during 2006–17.
Childhood Overweight & Obesity
Childhood obesity is a serious health problem in the United States where 1 in 5 children and adolescents are affected. Some groups of children are more affected than others, but all children are at risk of gaining weight that is higher than what is considered healthy.
Obesity is complex.
Many factors can contribute to excess weight gain including behavior, genetics and taking certain medications. But societal and community factors also matter: child care and school environments, neighborhood design, access to healthy, affordable foods and beverages, and access to safe and convenient places for physical activity affect our ability to
make healthy choices.
Every child deserves a healthy start in life.
Learn what parents and caregivers can to do help prevent obesity at home, how healthcare systems can help families prevent and manage childhood obesity, and what strategies communities can use to support a healthy, active lifestyle for all.
Discover more from Rich Kilchrist RDN LDN Registered Dietitian & Licensed Nutritionist
Subscribe to get the latest posts sent to your email.
